Generating tokens quickly is a key requirement for real-time AI applications. But in real-world applications, what matters most is being able to serve as many users as possible while generating tokens quickly enough for each user to ensure a good experience.
This metric – the number of users that an AI accelerator can serve while meeting a target Service Level Objective (SLO) per user – typically matters much more than chasing peak theoretical throughput for a single user.
RNGD, FuriosaAI's purpose-built inference accelerator for data centers, consistently serves more users than the NVIDIA RTX Pro 6000 across the standard SLO range of 20-40 TPS (ensuring the model is generating tokens faster than the user can read them, so there is no perceived latency). Because RNGD consumes significantly less power than RTX Pro 6000, this means enterprises can serve roughly twice as many users with each 15kW rack in their data centers while maintaining these important SLOs.
In this blog, we share details on these new benchmark comparisons, explain the architectural and software breakthroughs that enable RNGD to outperform RTX Pro 6000, and explore the specific enterprise services where it can be applied.
Performance optimization within the effective service range
Real-world deployments prioritize consistently high service quality. By targeting the widely used Qwen3-32B model, we tuned our SDK specifically to lift performance in the low-batch regions (below batch 64) where real-time traffic actually operates in the real world.
By building on this foundation, service providers can secure higher concurrent session counts, serve more end customers, and increase the effective utilization value of their infrastructure. This strategy aligns with the growing enterprise effort to support the increasing number of agents that each user now operates.
Keeping this rapidly growing demand for multi-agent systems that consume large numbers of tokens, we conducted performance optimization targeting 32B-class LLM models widely used in enterprise today.
The graph below compares Qwen3-32B performance on a server with 4x RNGD against one with 4x RTX Pro 6000.
The comparison to the RTX Pro 6000 is critical because customers running 32B-class inference recognized this tier as the most advantageous for purchase price and operational infrastructure utilization. It is therefore the product that RNGD directly competes against in this segment.
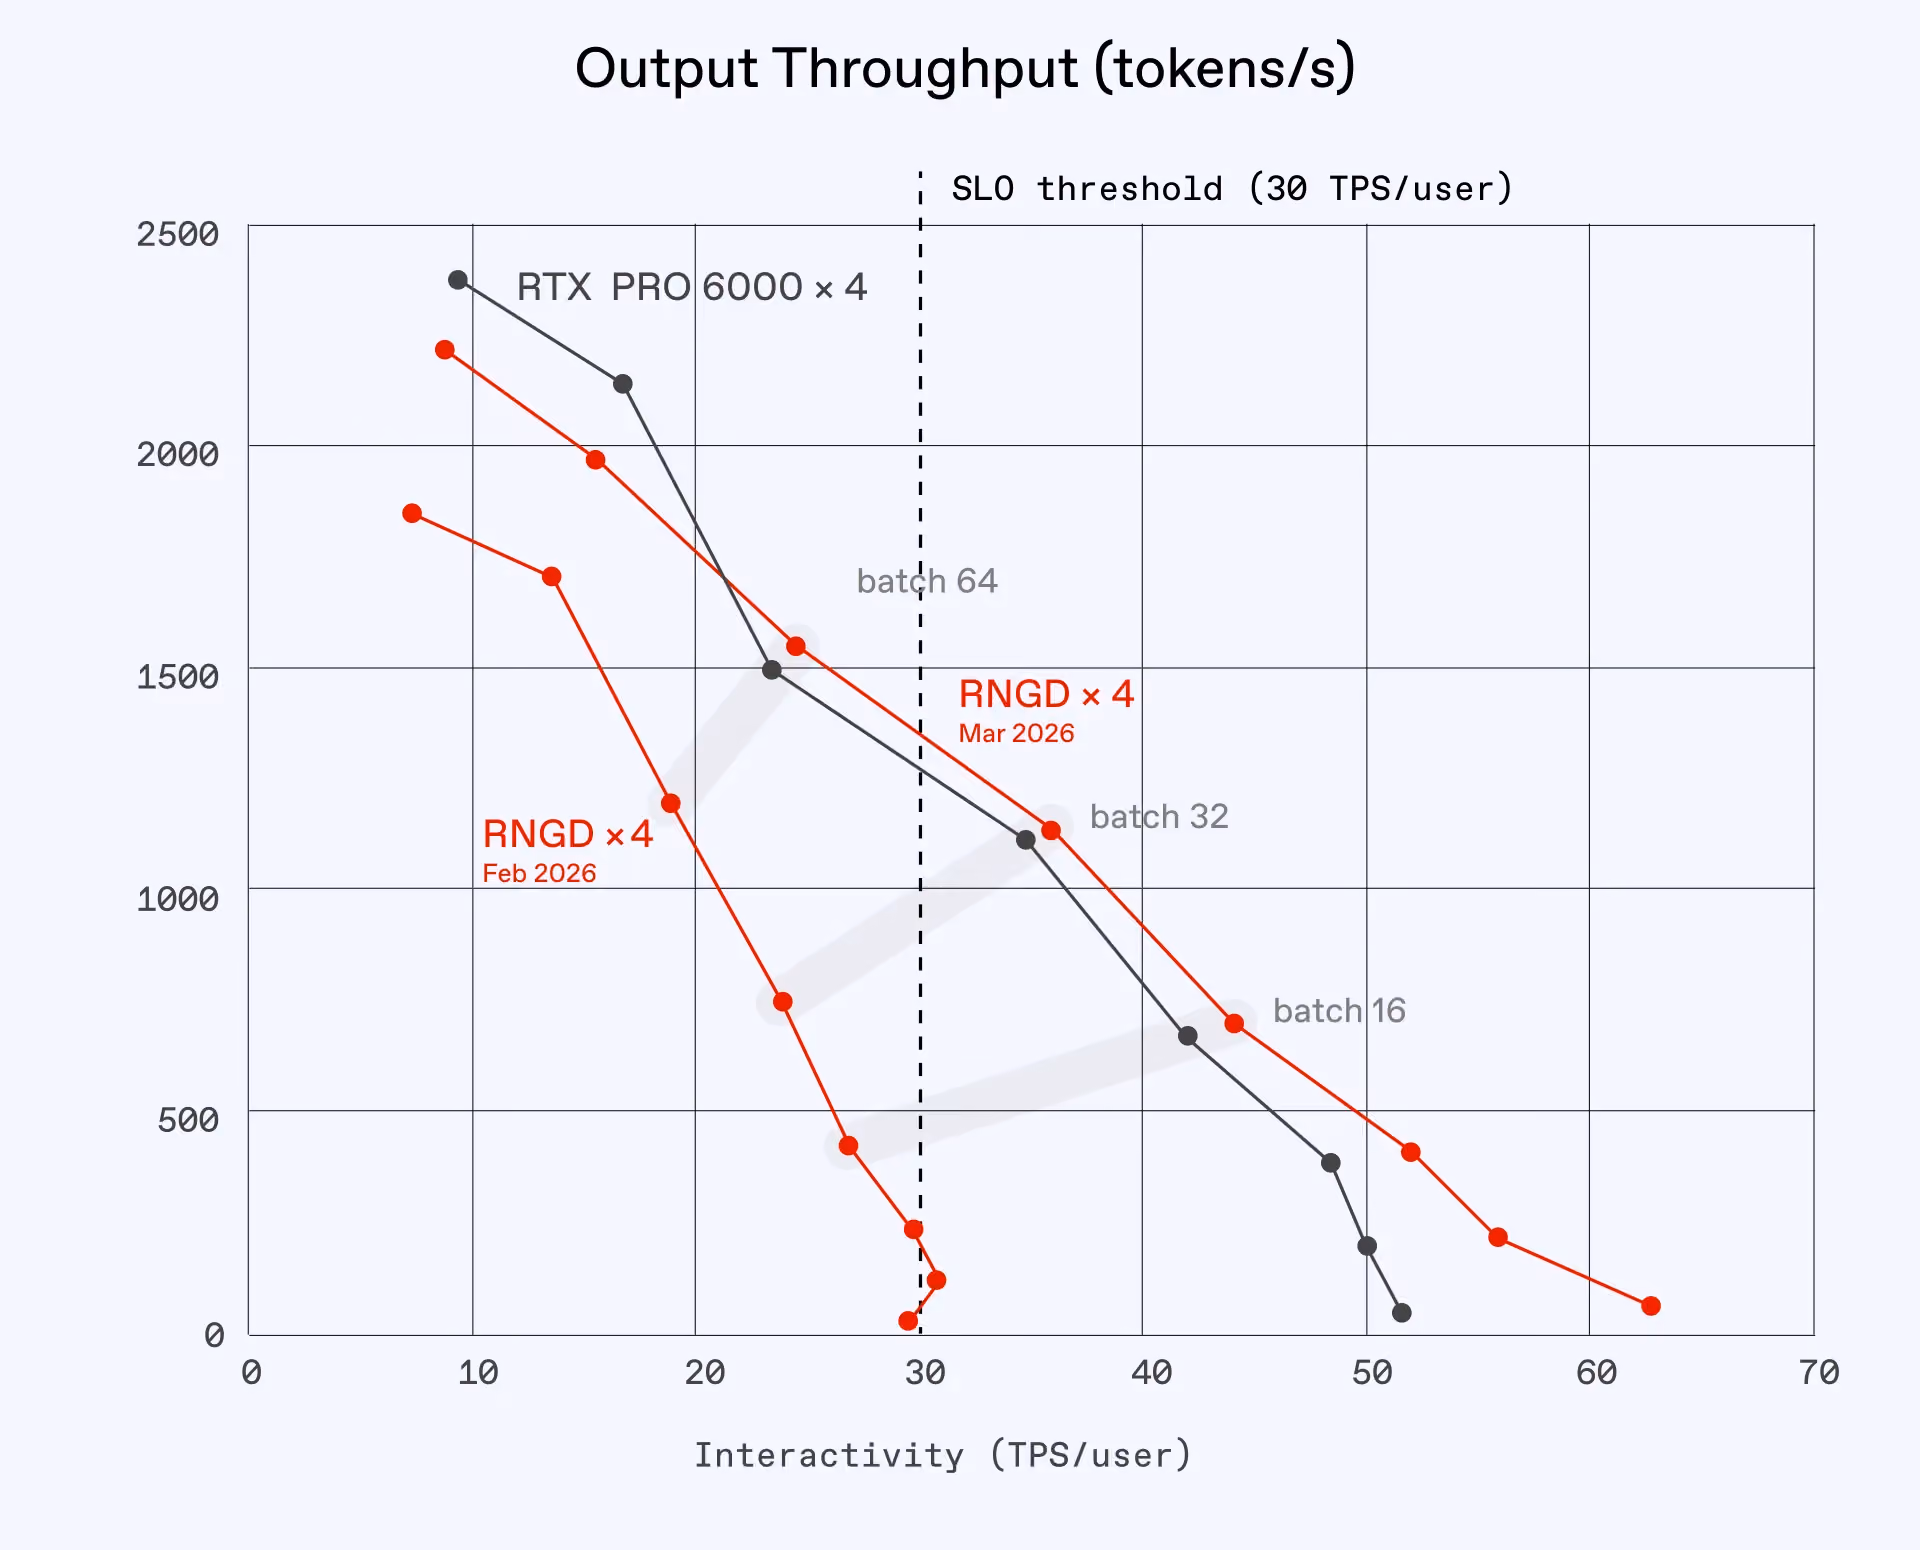
The chart above shows the rapid improvements made to Furiosa’s SDK. The SDK tuned through March 13, 2026, was optimized to excel in the 20-40 TPS/user range. This work focused on lifting performance in regions below batch size of 64 (b64), which differs from traditional tuning for maximum concurrency (b256 or higher).
Compared to the previous SDK versions released on February 14, 2026, RNGD’s performance for batch size of 64 (b64) improved from approximately 1,200 TPS to 1,500 TPS, and batch size of 32 (b32) improved from approximately 750 TPS to 1,100 TPS. This represents performance gains of 25% and 47%, respectively.
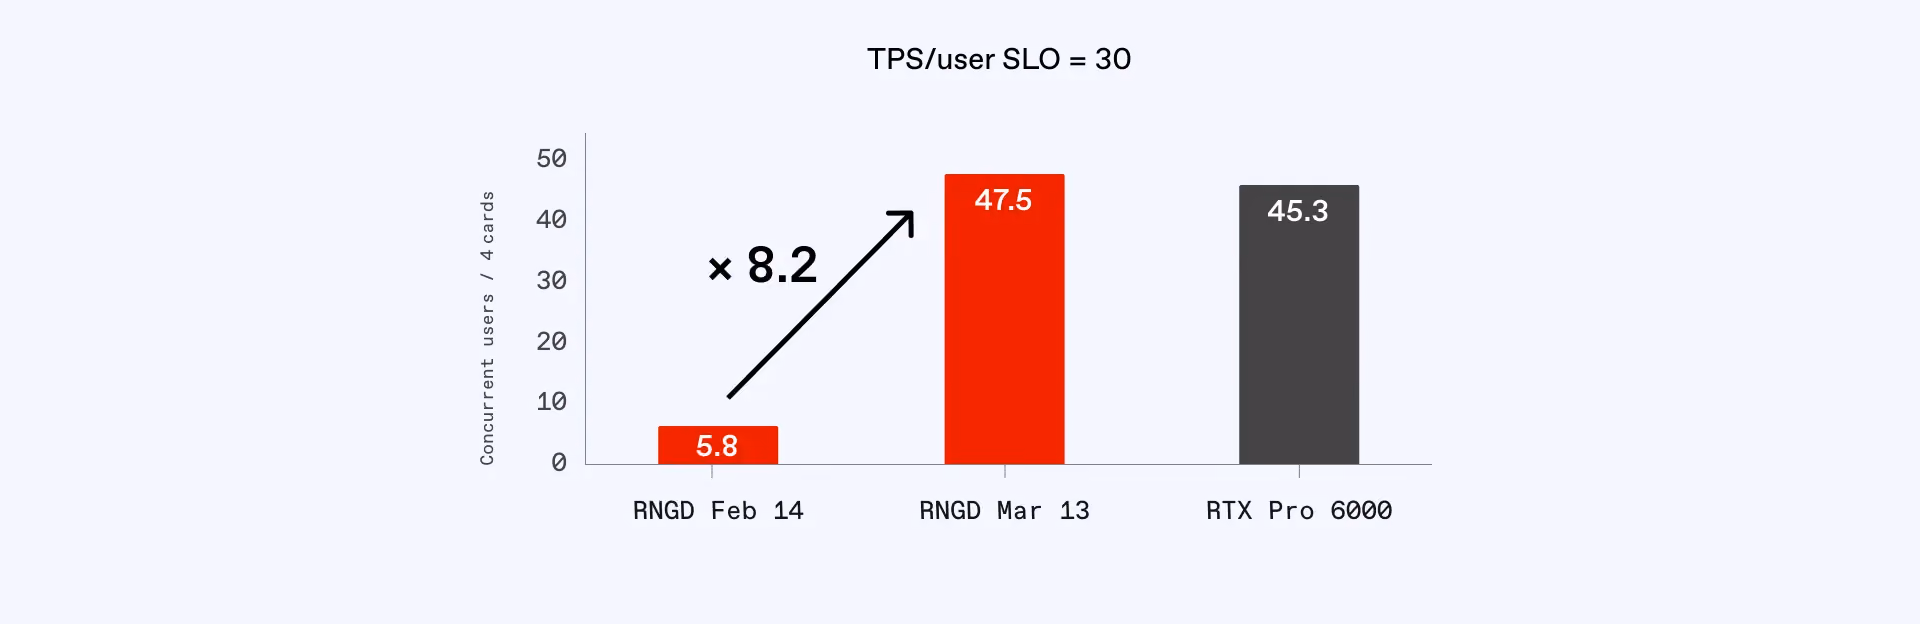
The impact is even more dramatic from a service perspective. A system previously capable of serving only 5.8 users increased to 47.5 users—an 8.2x increase in service capacity compared to our previous SDK.
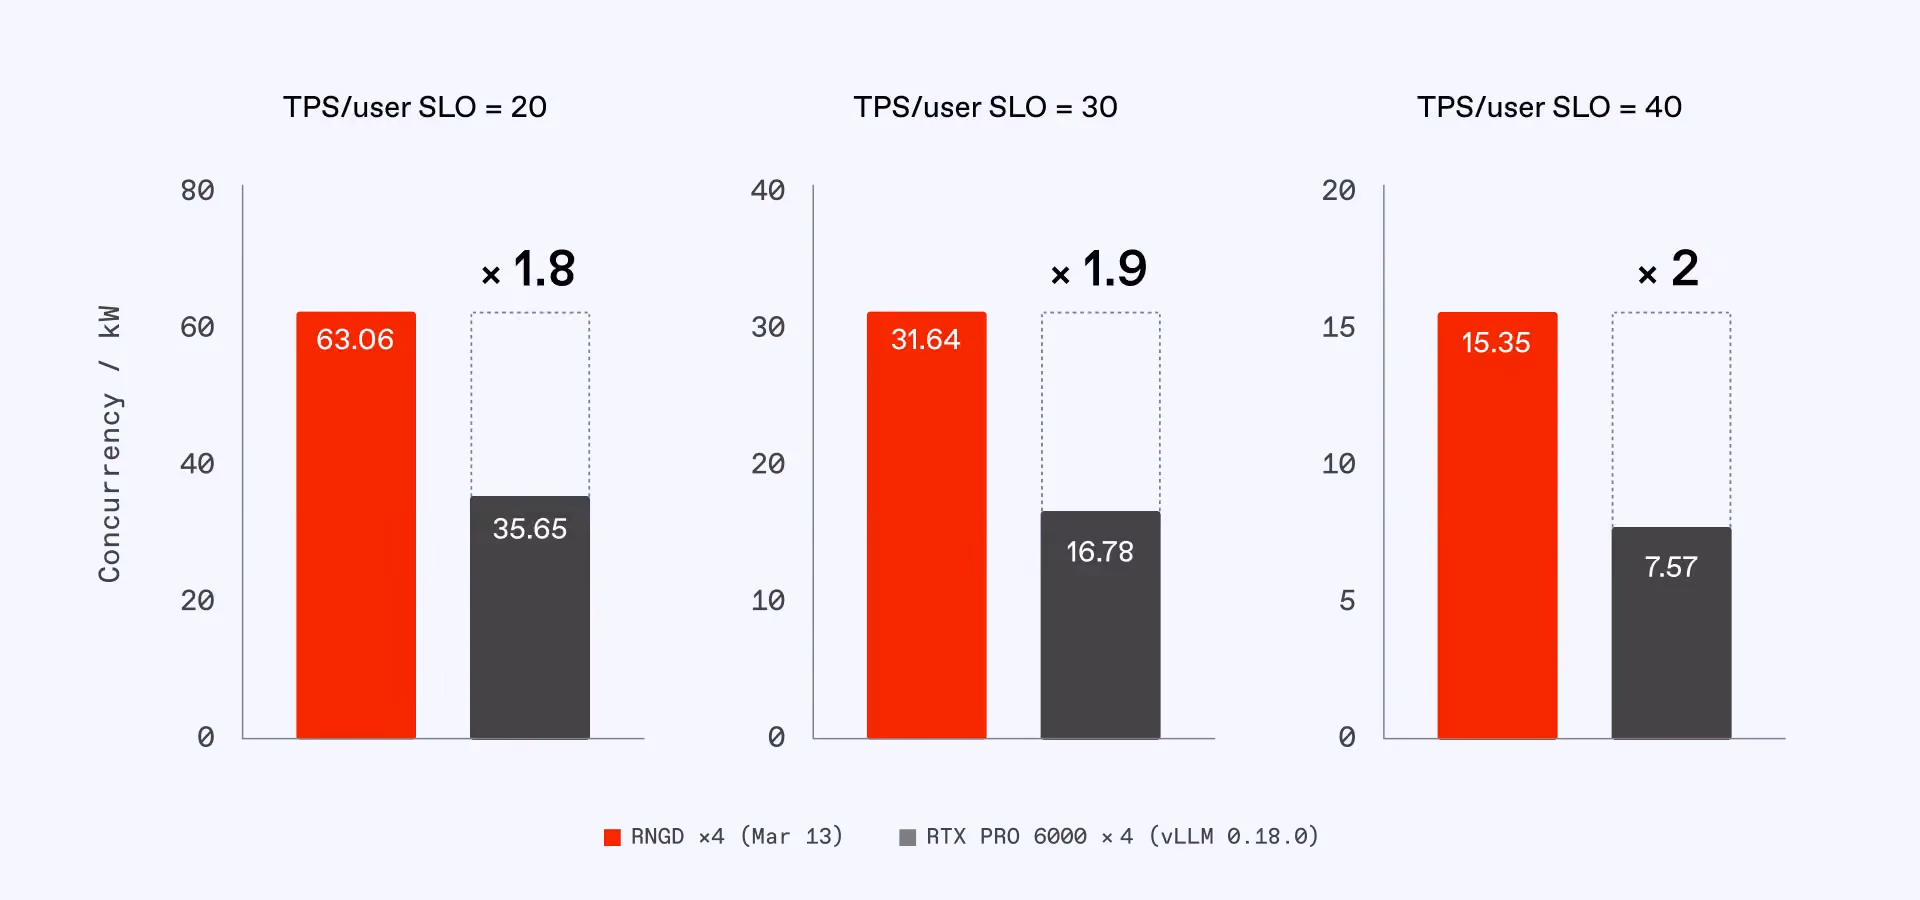
To extend this effect across the broader 20-40 TPS/user range, optimization was carried out for batch sizes 64, 32, 16, and 8. As a result, RNGD supported 1.8x, 1.9x, and 2x more users than the RTX Pro 6000 at SLOs of 20, 30, and 40 TPS, respectively (normalized for rack power).
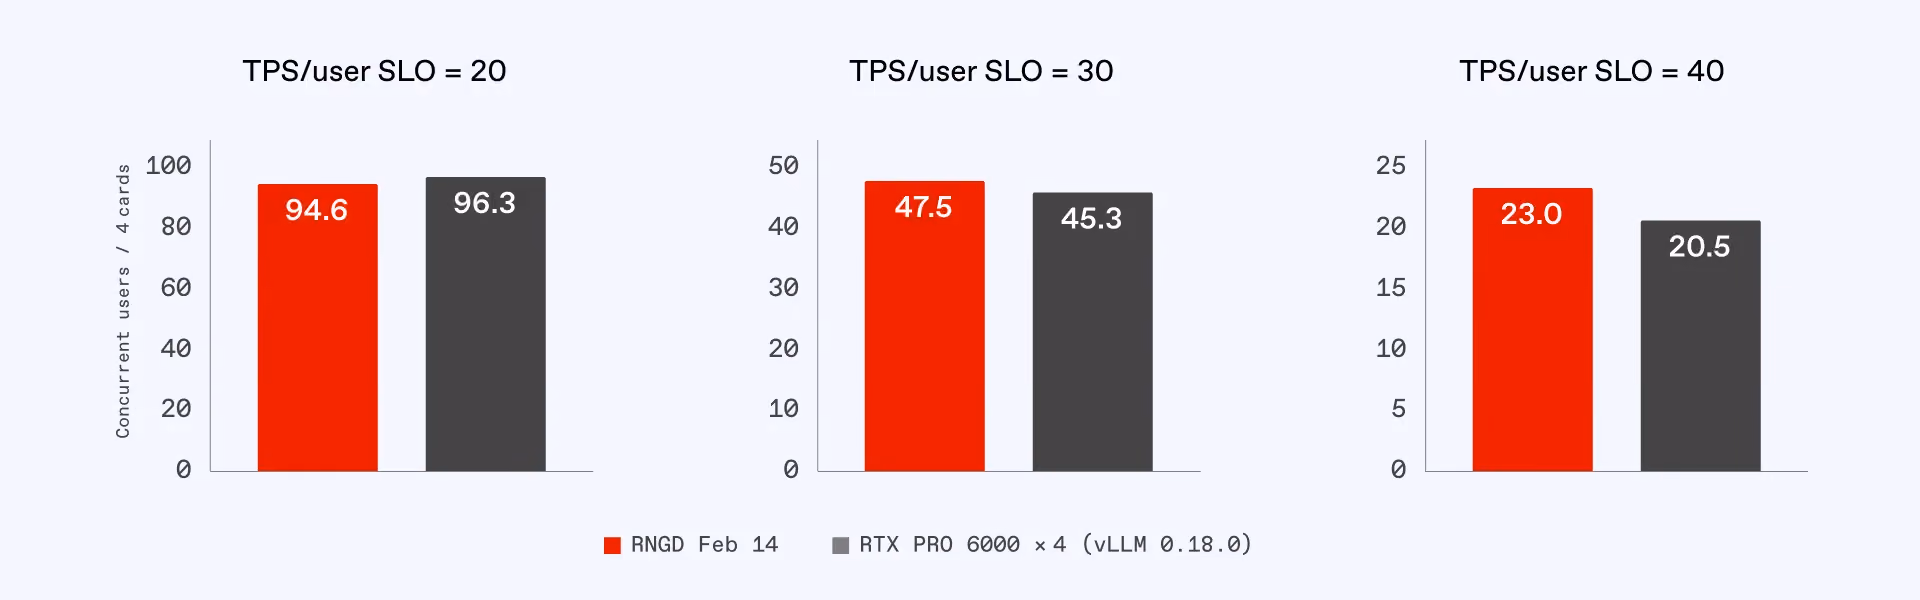
This chart compares the number of users served for a server with four RNGD cards and a server with four RTX Pro 6000 cards. Since RNGD consumes significantly less power, this translates to more users served for each standard 15kW rack.
Latency comparison: TTFT and TPOT
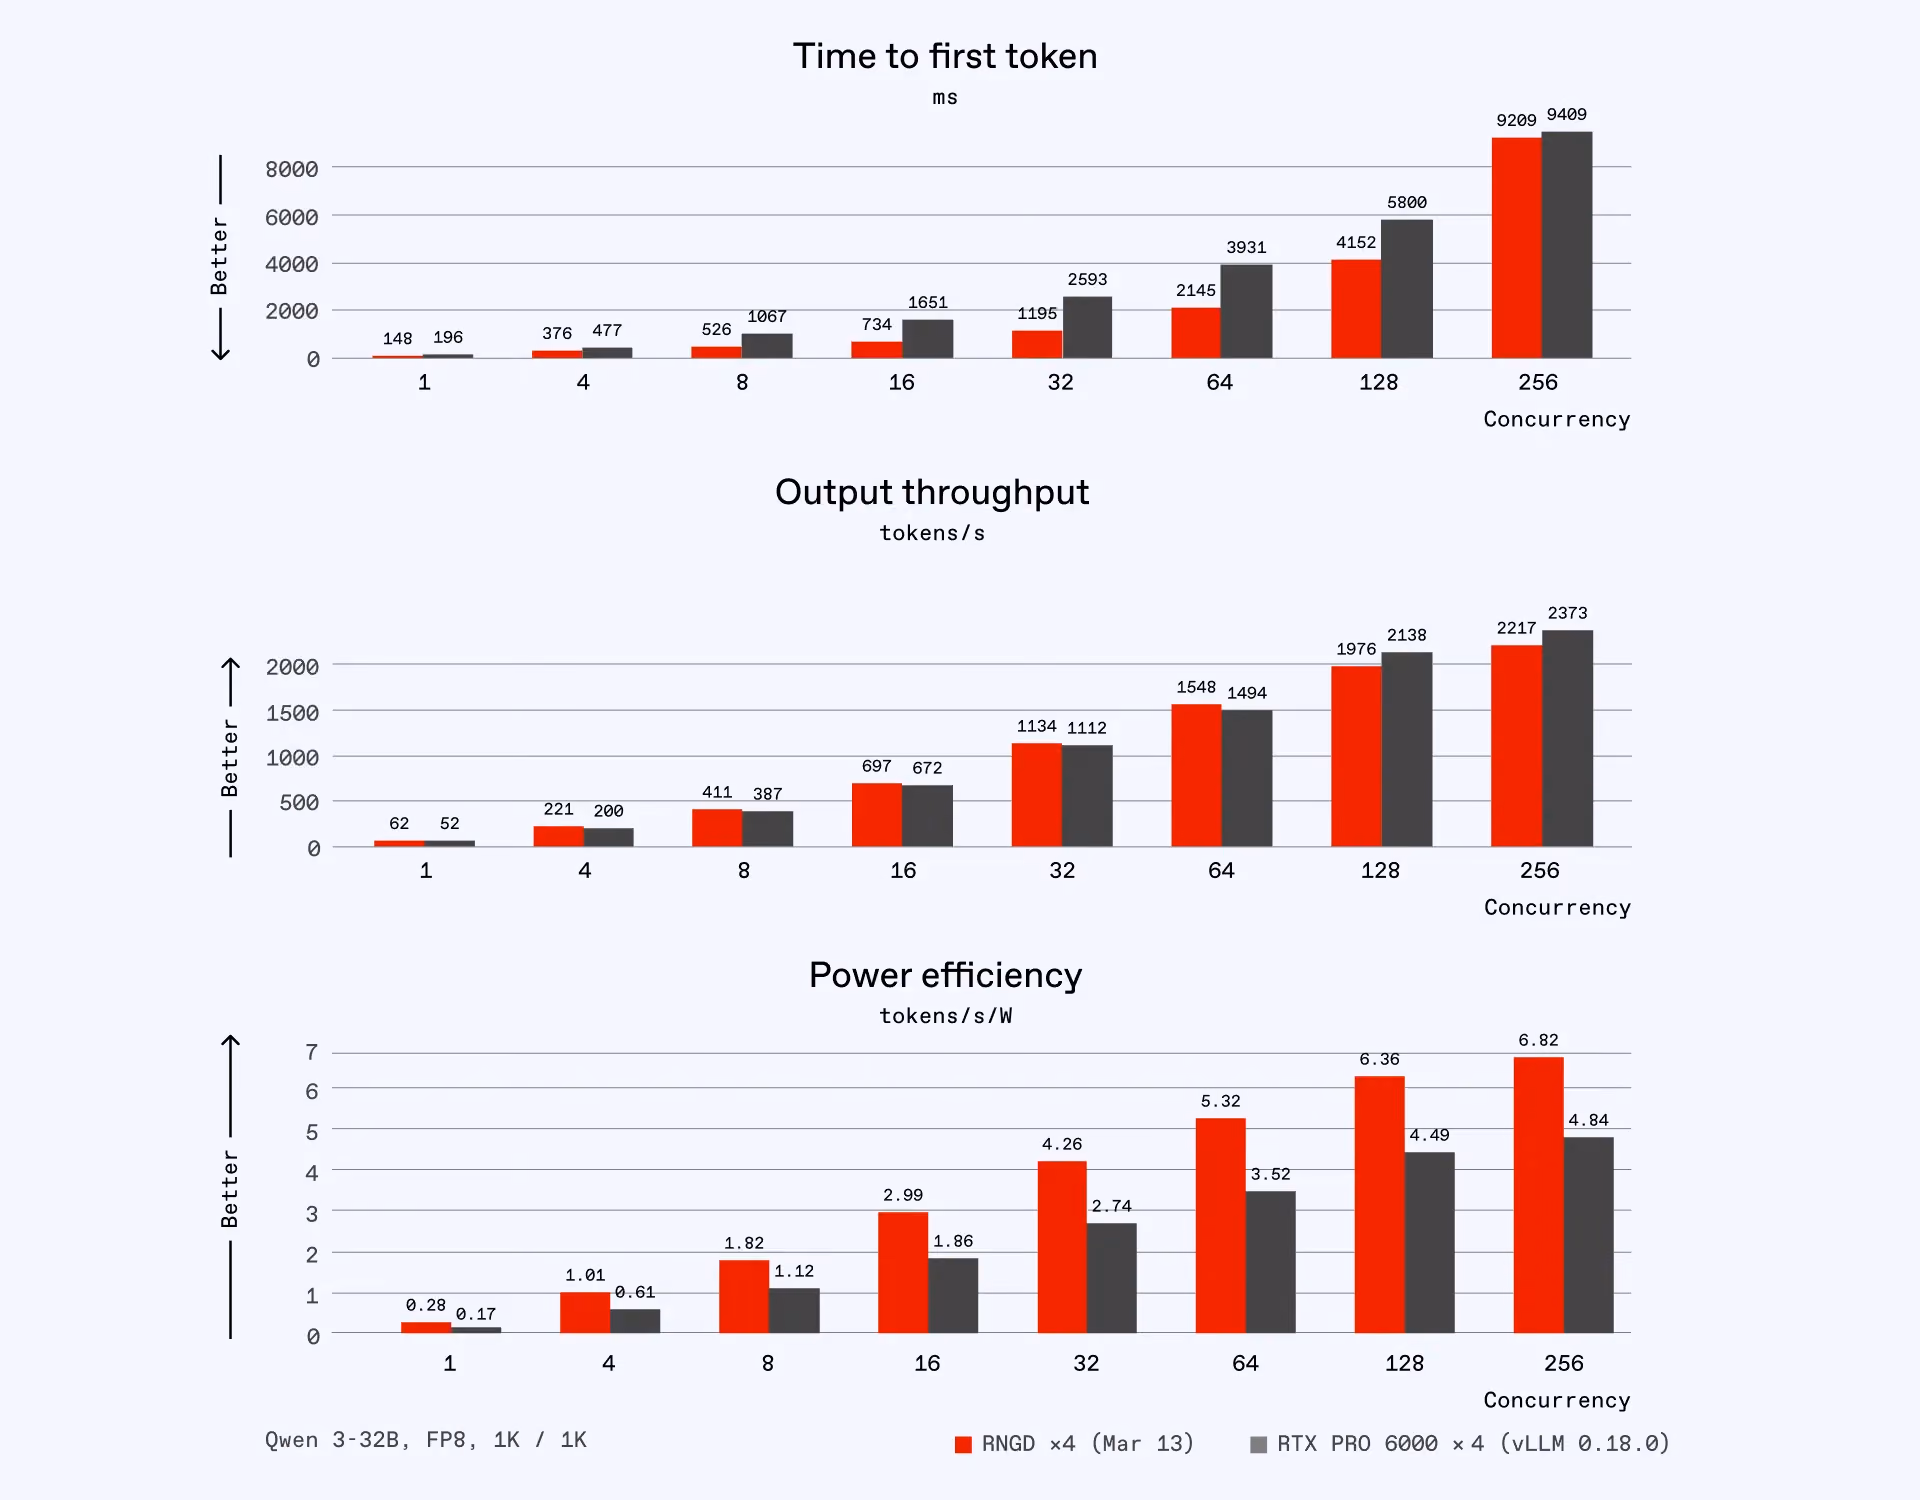
For Time-Per-Output-Token (TPOT), which has a greater impact on overall throughput, the graph shows that RNGD and RTX Pro 6000 exhibit similar numbers. However, RNGD maintains a slight edge in the targeted optimization range.
What is even more encouraging is the gap in Time-to-First-Token (TTFT). While TTFT is superior across all concurrency levels, RNGD shows roughly half the TTFT between batch size of 8 (b8) and batch size of 64 (b64), ensuring response times will feel notably fast when applied to real-world services.
For example, at a 30 TPS/User SLO, the RTX Pro 6000 produces its first token after 2.7 to 4.4 seconds, whereas RNGD outputs its first token in 1.1 to 2.1 seconds—less than half the latency of the RTX Pro 6000.
RNGD is significantly more power efficient across all ranges, and the ultimate implications of this will be explained in greater detail in the following section.
Greater service density through high power efficiency
Scaling AI services involves more than card-to-card comparisons. Different cards have varying power requirements, which dictates how many servers can realistically fit into an existing data center environment.
A server equipped with eight RNGD cards consumes 3kW of power, while a server equipped with eight RTX Pro 6000 cards consumes 6.6kW. In a standard 15kW rack, you can install five RNGD servers but only two RTX Pro 6000 servers. Because hardware must be installed in whole integers, the number of serviceable users increases in a step-wise fashion rather than a linear one.
This is where RNGD's power efficiency translates into greater service density. Even assuming the card-to-card user count was identical, RNGD’s 180W chip-level efficiency allows it to deliver more services at the rack level.
This is illustrated in the graph below. The X-axis represents the rack's power capacity, and the Y-axis represents the maximum number of simultaneous users.
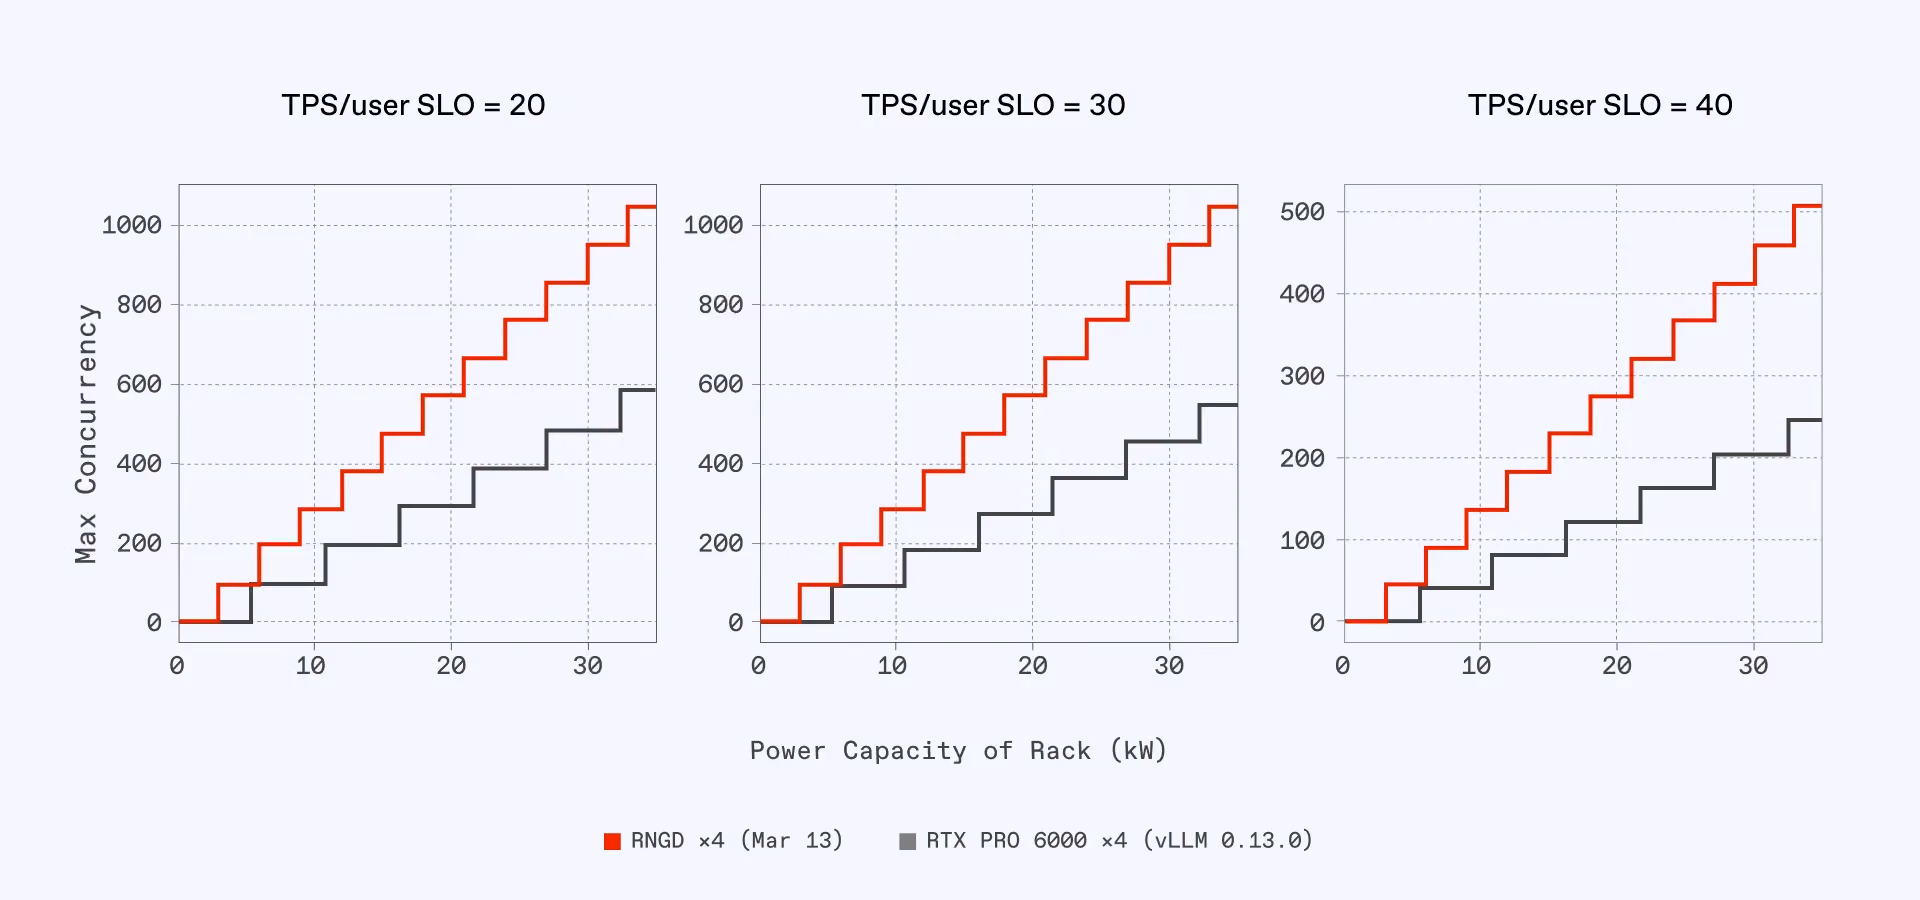
Assuming a customer has a power capacity of 15kW per rack and is targeting an SLO of 30 TPS/User, five RNGD servers can be installed, enabling 474 concurrent users per rack. Combined with card-level performance gains, RNGD allows this customer to serve 2.5x more users for each rack in their data center.
The graph below shows this difference normalized per kW. When the number of serviceable users from a 1:1 card comparison at each SLO is multiplied by the number of installable servers, the difference in user count becomes substantial.
Serving more users directly reduces the customer's Total Cost of Ownership (TCO). TCO is directly tied to how much the resources required to achieve a target service level can be reduced. Through RNGD's optimization within the effective service range, many customers are able to configure their services more efficiently.
Below, we have created scenarios estimating how many RNGD and RTX Pro 6000 units must be purchased, and how much the operating environment must be expanded, under the assumption of configuring actual services.
Example case study: An enterprise internal AI assistant
Company A has 10,000 total employees and has set a peak usage SLO to serve 2,000 concurrent users at 40 TPS.
Each employee currently uses only one agent, but the company is introducing multi-agent services. As each employee uses multiple agents simultaneously, the demand for high-density AI compute is expected to grow significantly, so each employee will use 10 agents simultaneously.
The currently secured infrastructure is configured at approximately 15kW per rack, with plans for further expansion.
Company A's current concurrent connections during peak time is 2,000. (10,000 × 20%)
At an SLO of 40 TPS/User, each RNGD Server can accommodate 46 users and each RTX Pro 6000 server can accommodate 41 users. However, when accounting for rack power limitations, the total number of racks required varies significantly:
- RNGD: 44 servers across 9 racks (132kW total)
- RTX Pro 6000: 49 servers across 25 racks (323.4kW total)
The facility will also need more floor space to accommodate 2.8x more 15 kW racks than with RNGD.
- RNGD NXT Server: 9 racks — 44 units ÷ 5 = 8.8
- RTX Pro 6000 Server: 25 racks — 49 units ÷ 2 = 24.5
(This calculation is purely for accelerators, excluding other equipment. Additional capacity would be needed when factoring in switches, compute servers, and other components.)
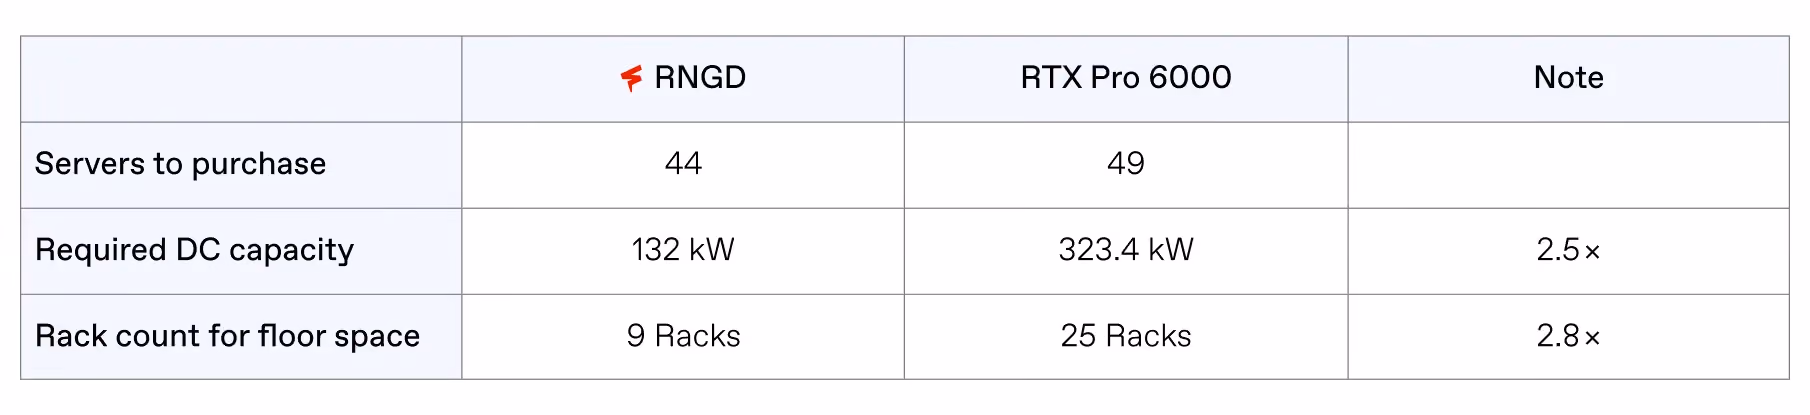
As shown in the table above, the difference is not just in the number of servers required. For RTX Pro 6000, 2.5x more data center capacity is needed. The facility will also need more floor space to accommodate 2.8x more racks than with RNGD.
This is a calculation proportional to current usage. If we assume that usage increases 10x due to Multi-Agent adoption, the absolute TCO gap widens dramatically—from a current difference of roughly 190 kW to approximately 2 MW at the datacenter level.
More servers in the same space with RNGD
FuriosaAI recently optimized RNGD for the service areas most widely utilized in real-world business. Enterprise services prioritize high concurrency, aiming to maintain service quality at 20–40 TPS/User. We directed RNGD's optimization efforts to align with this critical service range.
As a result, RNGD delivers higher concurrent services than the RTX Pro 6000 on a card-to-card basis within the target SLOs. The difference in concurrent service count is not merely a benchmark figure, but a gap that is directly felt in actual service operations.
This performance gap increases when RNGD's superior power efficiency is factored in. Since a RNGD server consumes less than half the power of the RTX Pro 6000 equivalent, more servers can be packed into the same datacenter environment. Multiplying the card-level performance advantage by the server density advantage expands the actual service capacity to 2x relative to a card-to-card comparison. This directly translates to a significant TCO reduction that will widen as multi-agent adoption grows.
Furthermore, the 20–40 TPS/User SLO is not limited to specific services. It is commonly applied across many real-time AI services, such as enterprise internal AI assistants, real-time customer support, AI tutoring, medical AI, and game NPCs. This means that the area RNGD has optimized for a broad service spectrum in the market.
Additional performance gains to come
What is particularly noteworthy is that these results were achieved purely through software changes in just one month. Without hardware modifications, SDK tuning alone delivered a 25–47% throughput improvement and 8.2x increase in concurrent service count for specific batch sizes, compared to the earlier version of our SDK.
The current optimization has only lifted a portion of the effective service range, and there remains room to drive additional performance gains at the software level in immediate response to evolving customer requirements or market shifts.
This rapid response is possible because of the inherent flexibility and scalability of Furiosa’s TCP architecture. RNGD was designed from the ground up to adapt to diverse workloads and models, and our mature software stack is built to swiftly address new models and service requirements.
These optimization results are only the beginning as we continue to expand performance boundaries in alignment with customer and market demands.
RNGD is currently in mass production. Contact us to learn more.
Written by
The Furiosa Team